
The global entertainment landscape is split into two massive, fundamentally different financial ecosystems: the traditional theatrical release and the direct-to-digital Over-The-Top (OTT) streaming model. While both paths share the goal of captivating audiences, the underlying mechanics of how capital is allocated, how risks are calculated, and how profits are extracted look entirely different under the hood. Budget Breakdowns of OTT vs Theatrical
Budget Breakdowns of OTT vs Theatrical Releases
For creators, studio executives, and investors, choosing between a multiplex rollout and an algorithm-driven streaming launch changes everything—from how much money is spent on the actual camera equipment to how actors are paid. Let’s break down the economics of both models.
- The Traditional Theatrical Model: High Risk, High Reward
[Typical Theatrical Budget Allocation] ┌───────────────────────────────────────┐ │ Production Budget (50-60%) │ ├───────────────────────────────────────┤ │ Marketing & P&A (40-50%) │ └───────────────────────────────────────┘
The theatrical ecosystem relies on an upfront financial gamble. Studios invest hundreds of millions of dollars into making a project, then double down by spending heavily on marketing to force a massive opening weekend. If the gamble pays off, the returns are uncapped. If it fails, the losses can instantly cripple a studio. Budget Breakdowns of OTT vs Theatrical
Budget Allocation Breakdown
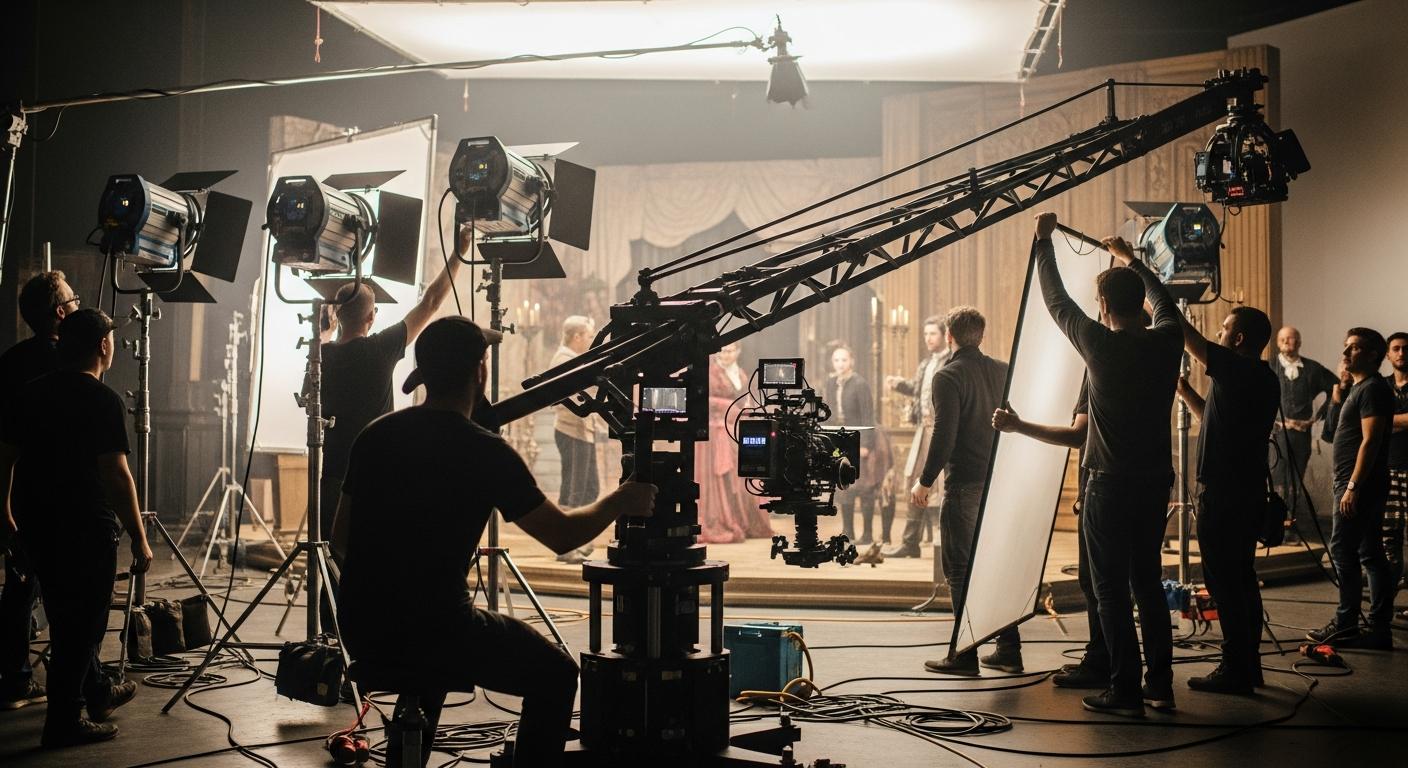
For a mid-to-high-budget theatrical feature, the expense pie is generally split into two major categories: the Production Budget (Negative Cost) and Print & Advertising (P&A).
- Production Budget (50%–60% of total cost): This covers the literal cost of creating the film. It includes script acquisition, director and A-list talent salaries, crew wages, physical set builds, location scouting, equipment rentals, and increasingly complex Visual Effects (VFX) and post-production work.
- Print & Advertising (40%–50% of total cost): This is the defining hallmark of the theatrical model. Studios routinely spend an amount equal to 50% to 100% of the film’s production budget just to market it. P&A includes creating global trailers, buying prime digital and TV ad slots, plastering physical billboards across major cities, and flying talent around the world for press junkets.
- The Box Office Revenue Split
A movie does not pocket every dollar it earns at the box office. Instead, ticket revenues enter a complex distribution funnel shared with movie theater owners (exhibitors).
Domestic Box Office (US/Canada): Generally, the studio and the theater split ticket sales roughly 50/50. In opening weeks, a studio might negotiate up to 60%, but that percentage slides back to the theater as the weeks progress
International Box Office: Due to foreign distribution fees, local taxes, and middlemen, studios typically only take home 35% to 40% of ticket sales. In tightly controlled foreign markets like China, that studio cut can drop to as low as 25%.
The Long-Tail Upside: While theatrical releases are expensive and heavily taxed by exhibitors, they unlock sequential, compounding revenue windows. A successful box office run serves as a multi-million-dollar advertisement for subsequent revenue windows: premium video-on-demand (PVOD) rentals, physical media, airplane/hotel licensing, television syndication, and eventually, streaming rights. Budget Breakdowns of OTT vs Theatrical

- The Direct-to-OTT Model: Controlled Risk, Capped Upside
[Typical Direct-to-OTT Budget Allocation] ┌───────────────────────────────────────────────────┐ │ Production Budget (80-85%) │ ├──────────────────────────┐ │ Marketing (15-20%) │ └──────────────────────────┘
Streaming platforms (such as Netflix, Amazon Prime Video, and Disney+) operate on a utility subscription model. Because their main objective is driving subscriber acquisition and preventing user churn, their budgeting philosophy prioritizes volume, demographic diversity, and algorithmic longevity over a singular explosive opening weekend. Budget Breakdowns of OTT vs Theatrical
Budget Allocation Breakdown
The budget structure of a direct-to-OTT film flips the traditional model on its head, primarily because the massive financial barrier of physical theatrical distribution is eliminated.
- Production Budget (85%–90% of total cost): A much higher percentage of the capital goes directly onto the screen. Because streamers bypass thousands of physical theaters, they do not need to manufacture digital cinema packages (DCPs), ship physical hard drives, or pay localized theatrical placement fees.
- Platform Marketing (10%–15% of total cost): Streamers rarely buy traditional billboard campaigns or expensive television ads for individual mid-budget films. Instead, they rely heavily on in-app algorithmic placement. The app interface itself is the primary billboard. Targeted push notifications, tailored home-screen trailers, and user data profiles do the heavy lifting of promoting the film to specific target audiences. Budget Breakdowns of OTT vs Theatrical
The Fixed Buyout and “Cost-Plus” Model
Unlike the box office, where a film’s financial payout relies completely on ticket sales, OTT film financing relies on fixed buyouts.
- The Flat Fee (“Cost-Plus”): Rather than letting a filmmaker retain ownership to collect royalties, a streaming network will often buy out all global rights to a movie upfront. They pay the full production cost plus an agreed-upon premium (typically a 10% to 20% profit margin) directly to the producers.
- Elimination of Backend Residuals: This structure guarantees immediate profitability for the filmmakers and removes financial risk. However, it completely caps the financial upside. If an OTT original becomes a massive cultural phenomenon, the creators do not see a massive surge in box office royalties. The financial win belongs entirely to the streaming platform in the form of sustained subscription renewals. Budget Breakdowns of OTT vs Theatrical
3. Direct Head-to-Head Comparison
To see how these differences play out, consider how a hypothetical $100 million total budget is utilized across both systems:
| Financial Metric | Theatrical Release ($100M Total) | Direct-to-OTT Release ($100M Total) |
| Money Spent on the Screen | ~$55 Million (Production) | ~$85 Million (Production) |
| Money Spent on Marketing | ~$45 Million (Global P&A) | ~$15 Million (Platform/In-App) |
| Primary Financial Risk | High: Extreme reliance on opening weekend performance. | Low: Insulated by upfront platform funding. |
| Revenue Stream Architecture | Waterfall: Tiered revenue over months/years (Theaters $\rightarrow$ VOD $\rightarrow$ TV). | Flat: Upfront payout; monetization tied to platform ecosystem retention. |
| Profit Ceiling | Unlimited: Can gross multiples of its budget if it becomes a hit. | Capped: Profit is fixed by the pre-negotiated acquisition contract. |
- The Modern Hybrid Coexistence Strategy
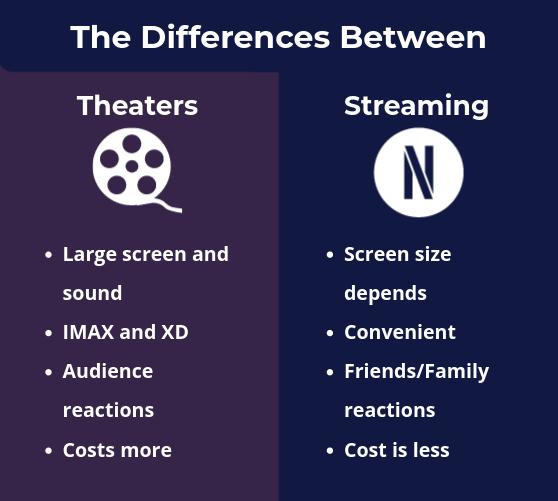
As the entertainment economy stabilizes, the industry has largely abandoned the strict “streaming vs. cinema” format war in favor of an optimized, complementary hybrid strategy.
High-concept, visual spectacles (like superhero franchises, massive action epics, and sci-fi blockbusters) continue to firmly belong to the theatrical pipeline. These projects require the sheer financial scale of global ticket windows to recoup $200+ million production investments. Budget Breakdowns of OTT vs Theatrical
Conversely, mid-budget character dramas, niche comedies, romantic stories, and experimental indie films have found a much safer, more sustainable home in the optimized world of OTT platforms. By stripping away the crushing pressure of multi-million dollar P&A theatrical marketing budgets, streaming ensures these diverse, narrative-driven stories can be made profitably while finding their audiences directly at home. Budget Breakdowns of OTT vs Theatrical
Also read the New OTT releases this week in Telugu(April 13 – 17, 2026)
Also read the Upcoming OTT Releases This Week in Telugu (April 27 – May 03, 2026)
For more Info, Please Visit the Netflix , Zee 5, Prime Video